
Effective progress monitoring reveals the harsh truth: that 65% completion report on your master project dashboard is dangerously misleading. Your gut tells you the project is on fire, and you’re right to be worried about inadequate progress monitoring systems that fail to identify critical construction bottlenecks.
Because as a Project Manager, you know the truth: overall progress is a meaningless metric.
That 65% average is dangerously misleading. It actively hides the reality you suspect—that while the easy-to-access accommodation decks are 90% complete, the complex, critical engine room or wheelhouse is sitting at a terrifying 15%. The most significant risk to your entire project schedule is invisible in the high-level report, buried under the tyranny of the average.
This is the core challenge of managing a complex physical asset with flat, context-free data. A simple list of tasks, no matter how detailed, cannot answer the most important question for any manager: Where, exactly, are we falling behind?
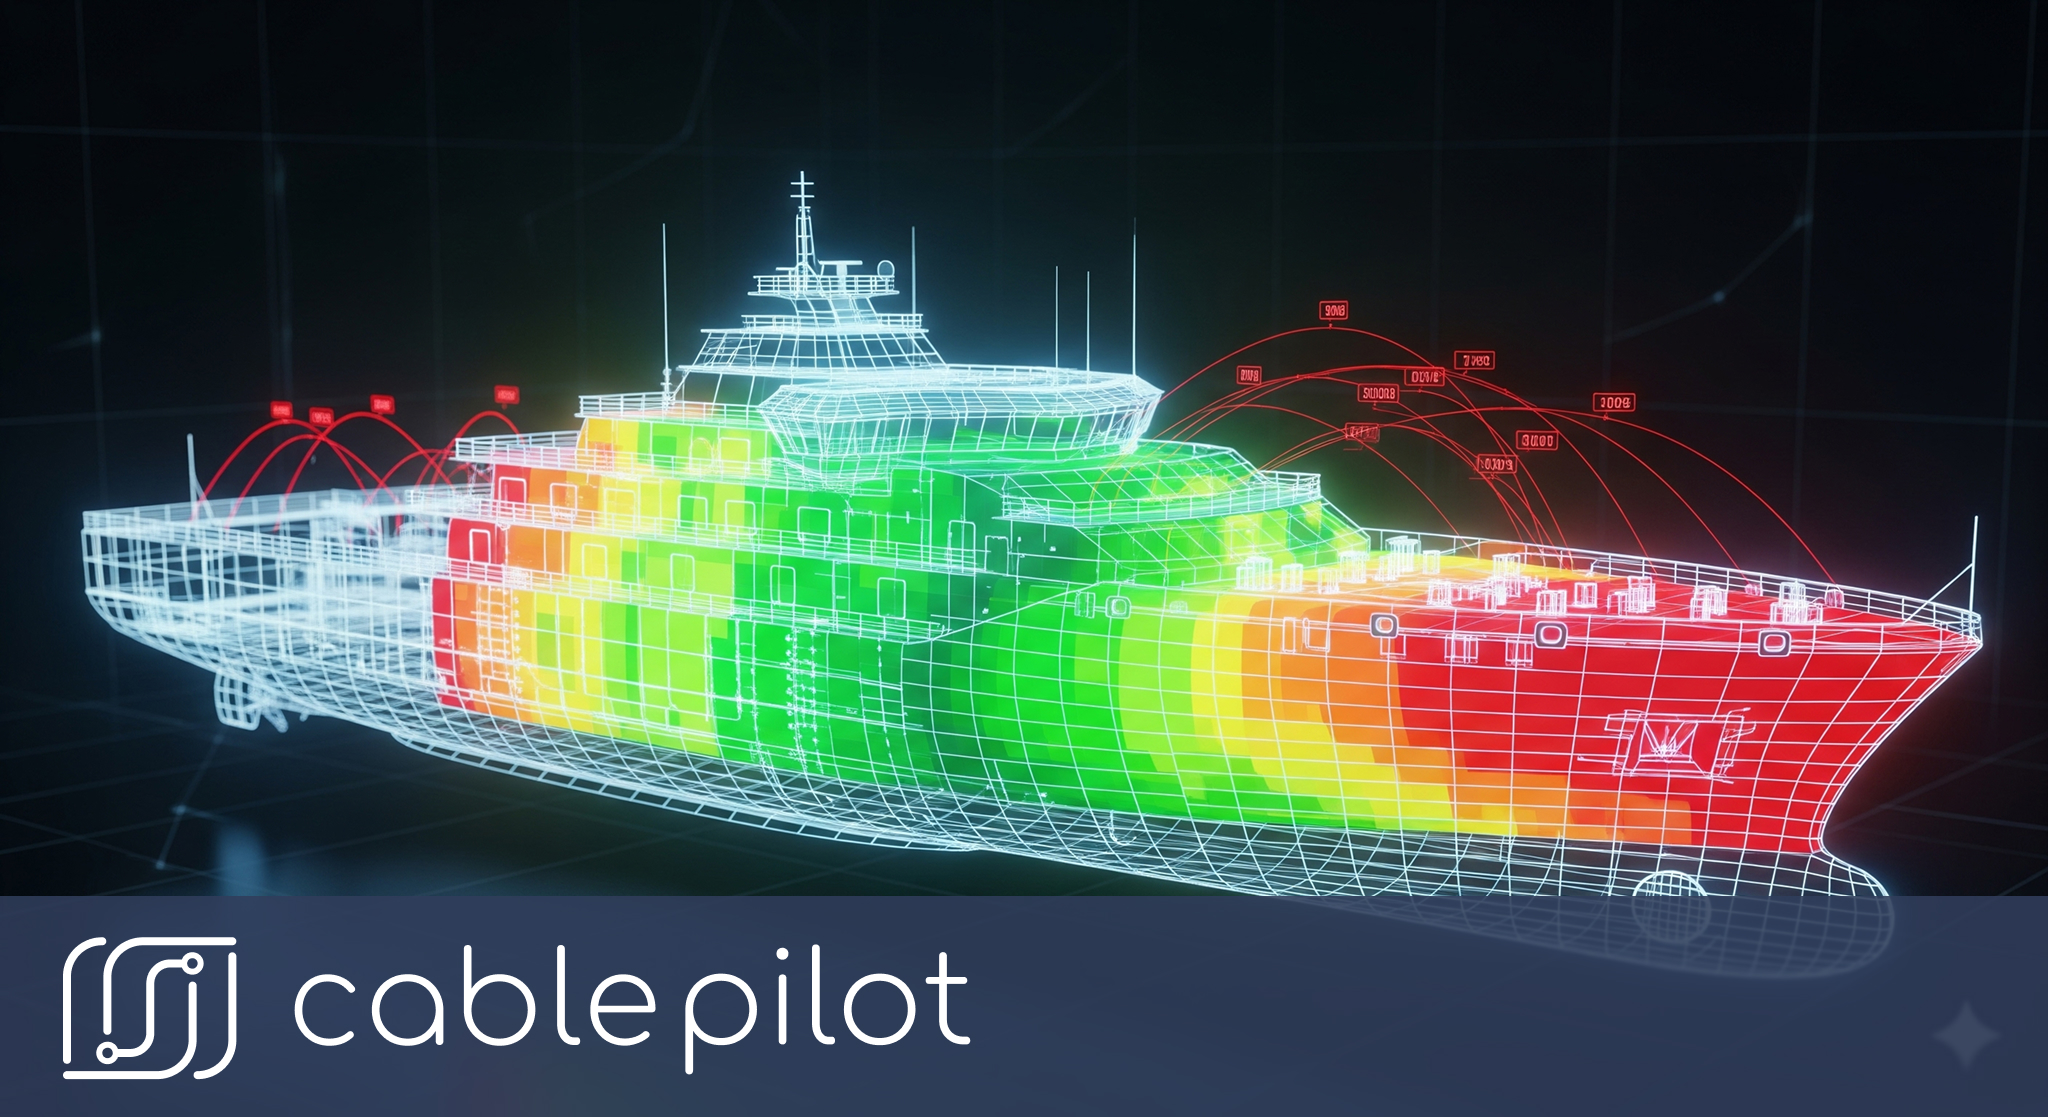
In this article, we will dismantle the illusion of “average” progress monitoring. We will demonstrate how shifting to Spatial Accountability—spatial progress monitoring within the context of the vessel’s actual physical hierarchy—transforms your management capabilities. Advanced digital twin construction techniques enable unprecedented project oversight. You’ll learn how to turn your project data into a “heat map” that instantly reveals bottlenecks, allowing you to move from reactive problem-solving to proactive, location-aware strategic management.
The Blindness of Flat Lists
Traditional project management tools force you into a state of spatial blindness. Spreadsheets and generic task trackers are fundamentally flawed because they strip away the most important piece of context: location. They can tell you what needs to be done, but they can’t easily tell you where.
Imagine a Site Manager looking at a task list of 1,000 remaining cables. The list shows their IDs, statuses, and required man-hours. But to figure out which of those cables belong to “Deck 5, Zone 2,” he would need to perform hours of manual filtering, cross-referencing with other documents, and data manipulation. This zone-based management approach creates inefficiencies that location-based tracking systems are designed to eliminate. By the time he gets an answer, the information is already out of date.
This lack of spatial context makes effective tactical management impossible. You cannot efficiently allocate your teams if you don’t know where the highest concentration of remaining work is located. You are essentially managing blind, relying on gut feelings and unreliable reports from the field rather than hard data.
Turning on the “Project GPS”: Progress Monitoring by Hierarchy
To solve this, you need to stop managing a list and start managing a map. You need to give your project a “GPS” by building your entire management system upon a foundation that understands its physical structure.
This is where a purpose-built platform like Cable Pilot provides a decisive advantage. Instead of treating your project as a flat list of tasks, it begins by creating a digital twin based on the vessel’s physical hierarchy. Digital twin progress monitoring revolutionizes how you visualize and manage project workflows.

Every single asset and every single task is intrinsically linked to its precise location within this structure:
- Vessel -> Area (e.g., Machinery space)
- Vessel -> Deck (e.g., Main Deck)
- Deck -> Compartment (e.g., C-301)
- Area -> Compartment (e.g., Auxiliary Engine Room)
This simple, logical structure is the key that unlocks true spatial accountability. Your data is no longer a context-free list; it’s a rich, navigable map of your entire project.
From Blurry Averages to Sharp Focus: Two Levels of Spatial Insight
When every task has a physical address, you gain a level of clarity that is impossible with traditional methods. This new vision empowers managers at both the tactical and strategic levels.
Level 1: Tactical Precision for the Site Manager
It’s 1:00 PM. A Site Manager has a team of electricians that has just finished their morning’s work ahead of schedule. He needs to deploy them to the next most critical area to maintain momentum.
The Old Way (Guesswork):
He might remember a conversation about some pending work on Deck 4, or he might have to spend 20 minutes on the phone with various foremen to get a feel for where the team is needed most. This is slow, inefficient, and based on incomplete information.
The New Way (Data-Driven Deployment):
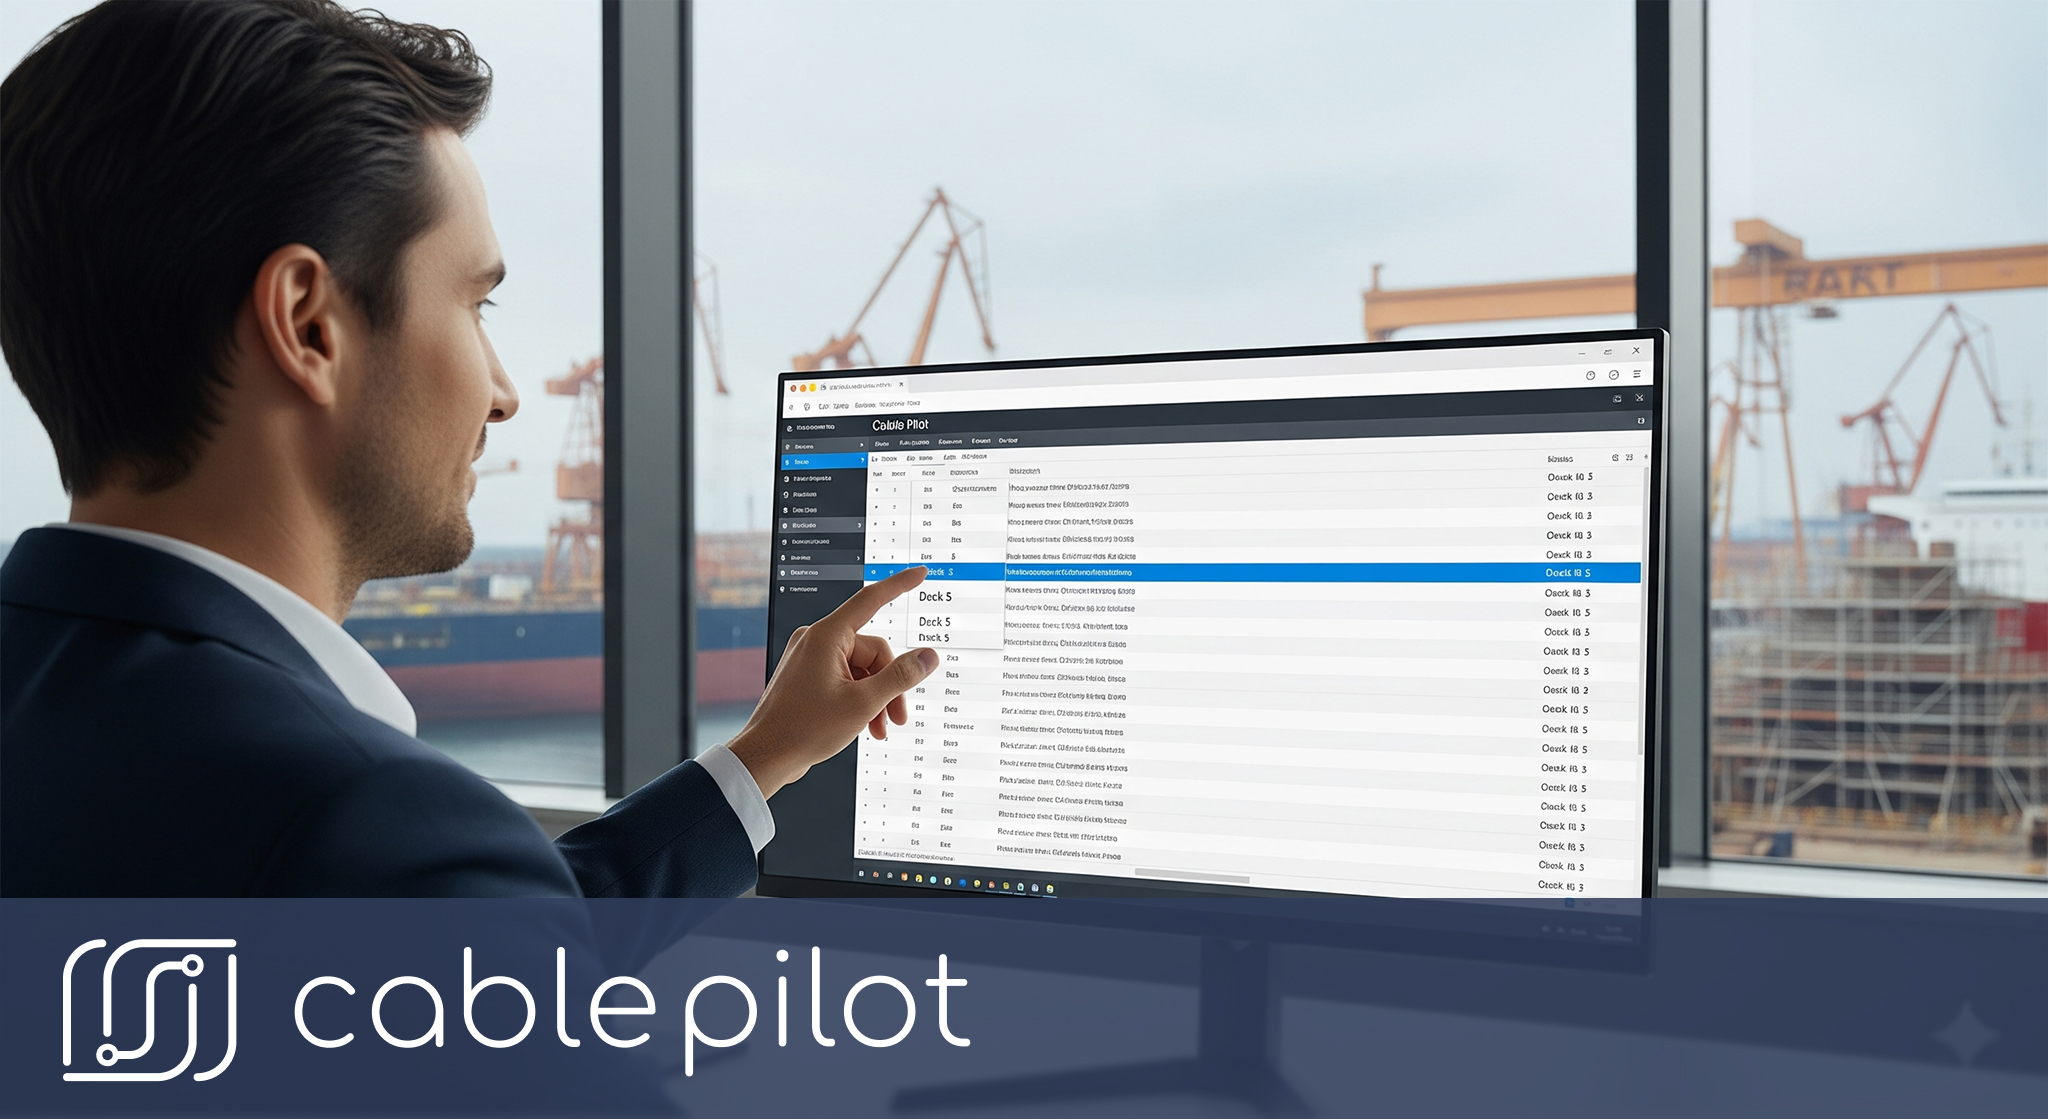
The Site Manager opens his tablet. He applies a simple filter to his project dashboard:
“Show all ‘To Do’ tasks, grouped by Compartment.”
Instantly, the system displays a clear, prioritized list, revealing that Compartments C-301 and C-302 on Deck 3 hold the highest concentration of ready-to-start work. The 20 minutes he would have spent on phone calls is eliminated, and his team is redeployed in seconds, not hours. He doesn’t need to guess. He knows exactly where the center of gravity for the afternoon’s work is. He redeploys his team with a precise, data-backed instruction: “Proceed to Deck 3, Compartments C-301 and C-302.”
Level 2: Strategic Clarity for the Project Manager
Meanwhile, the Project Manager is preparing for his weekly risk assessment meeting. He needs to understand where the biggest threats to the project schedule are hiding.
The Old Way (Averages and Anxiety):
He looks at the master report: 65% complete. This number tells him nothing. It gives him no insight into whether the remaining 35% is easy or hard, concentrated or spread out. He is forced to rely on subjective updates from his site team, which may downplay potential problems.
The New Way (The Project “Heat Map”):
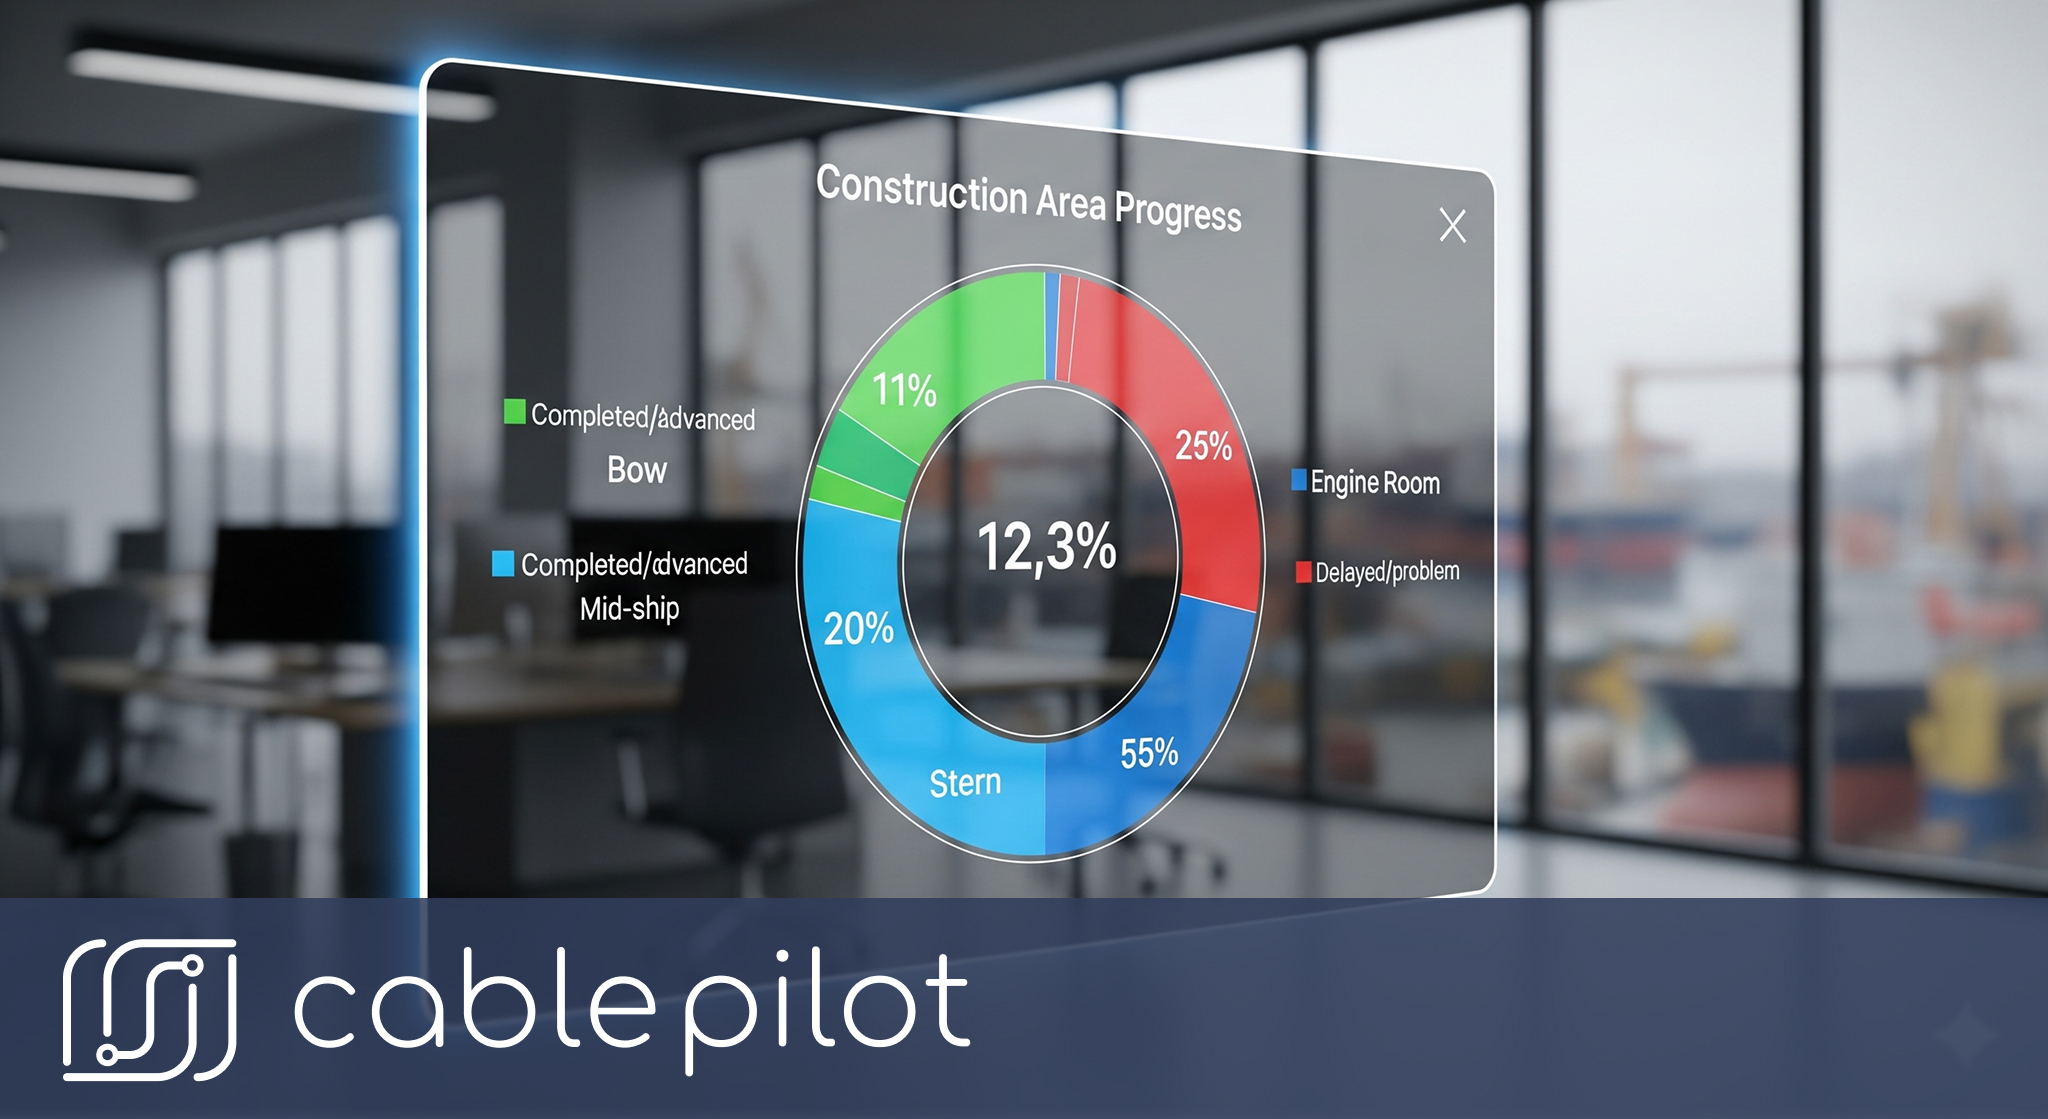
The Project Manager looks at his main dashboard, specifically at a widget configured to show “Progress by Area.” The visual is instant and intuitive—a “heat map” of his project’s health:
- Accommodation Decks: 80% Complete (Green)
- Superstructure: 75% Complete (Green)
- Cargo Holds: 60% Complete (Yellow)
- Engine Room: 15% Complete (Red)
In five seconds, the comfortable illusion of the 65% average is shattered. The dashboard exposes it as a dangerous distraction, revealing the real story. The real story is the glaring red bar of the Engine Room. This is the project’s primary strategic risk, and it’s now clearly visible to everyone.
With this knowledge, the Project Manager can act. He can “drill down” into the Engine Room data to see the progress by deck, by compartment, and even by system, to understand the precise root cause of the delay. Is it a supply chain issue? A contractor performance problem? A design hold-up? The data gives him the power to ask the right questions and focus his entire team’s attention on the area that matters most.
Conclusion: Manage the Space, Not Just the Schedule
Spatial Accountability is the difference between managing a list of tasks and managing a real-world, three-dimensional object. By structuring your project data around a physical hierarchy, you give yourself and your team the power of context. Modern shipbuilding operational efficiency requires this level of precision and comprehensive oversight of complex marine engineering projects. Achieving superior shipbuilding operational efficiency demands progress monitoring systems that understand the unique spatial complexities of vessel construction.
You are no longer blind to the problems hiding behind misleading averages. You can see the “hot spots” and “cold spots” of your project in real-time. Through effective progress monitoring, you can allocate resources with surgical precision, address construction bottlenecks before they become a full-blown crisis, and communicate with your client using a clear, visual representation of the project’s true status. Location-based tracking technology enables this level of real-time visibility that was previously impossible.
Stop managing the spreadsheet. Start managing the ship.
Want to see a “heat map” of your own project and instantly identify your biggest risks? Explore our comprehensive project management solutions and request a demo to see location-based progress monitoring in action.