

Are you confident that you’re paying your contractors for real progress, or are you just paying for the appearance of activity?
For a Project Manager overseeing a complex shipbuilding project, contractor performance analysis is a high-stakes question. You have multiple contractors on site. On the surface, they all seem busy. Their weekly reports show progress. But you have a gut feeling—a nagging suspicion born from experience—that some teams are delivering far more value than others. The problem is, you have no objective data to prove it.
Any conversation about performance quickly devolves into a subjective argument.
- “Our section was more complex.”
- “We spent more time on preparation.”
- “You can’t compare our work to theirs.”
You’re left in a managerial fog, unable to identify your top performers, diagnose the root cause of inefficiency, or make data-driven decisions about where to allocate your resources.
This practical shipbuilding case study will dissect this exact scenario.
Using a realistic example, we will demonstrate how traditional metrics create a dangerous illusion of equality. We will then show how a shift to a standardized unit of workload—Cable Points (CP)—can shatter that illusion, providing the objective clarity needed to transform your contractor performance analysis from guesswork into a powerful management tool.
The Setup: An Illusion of Equal Performance
Let’s consider a common scenario on a large vessel construction project. You have two electrical contractors, Team A and Team B, working in different but comparable sections of the ship. Your primary goal is to drive shipyard efficiency, and you rely on weekly progress reports to track performance.
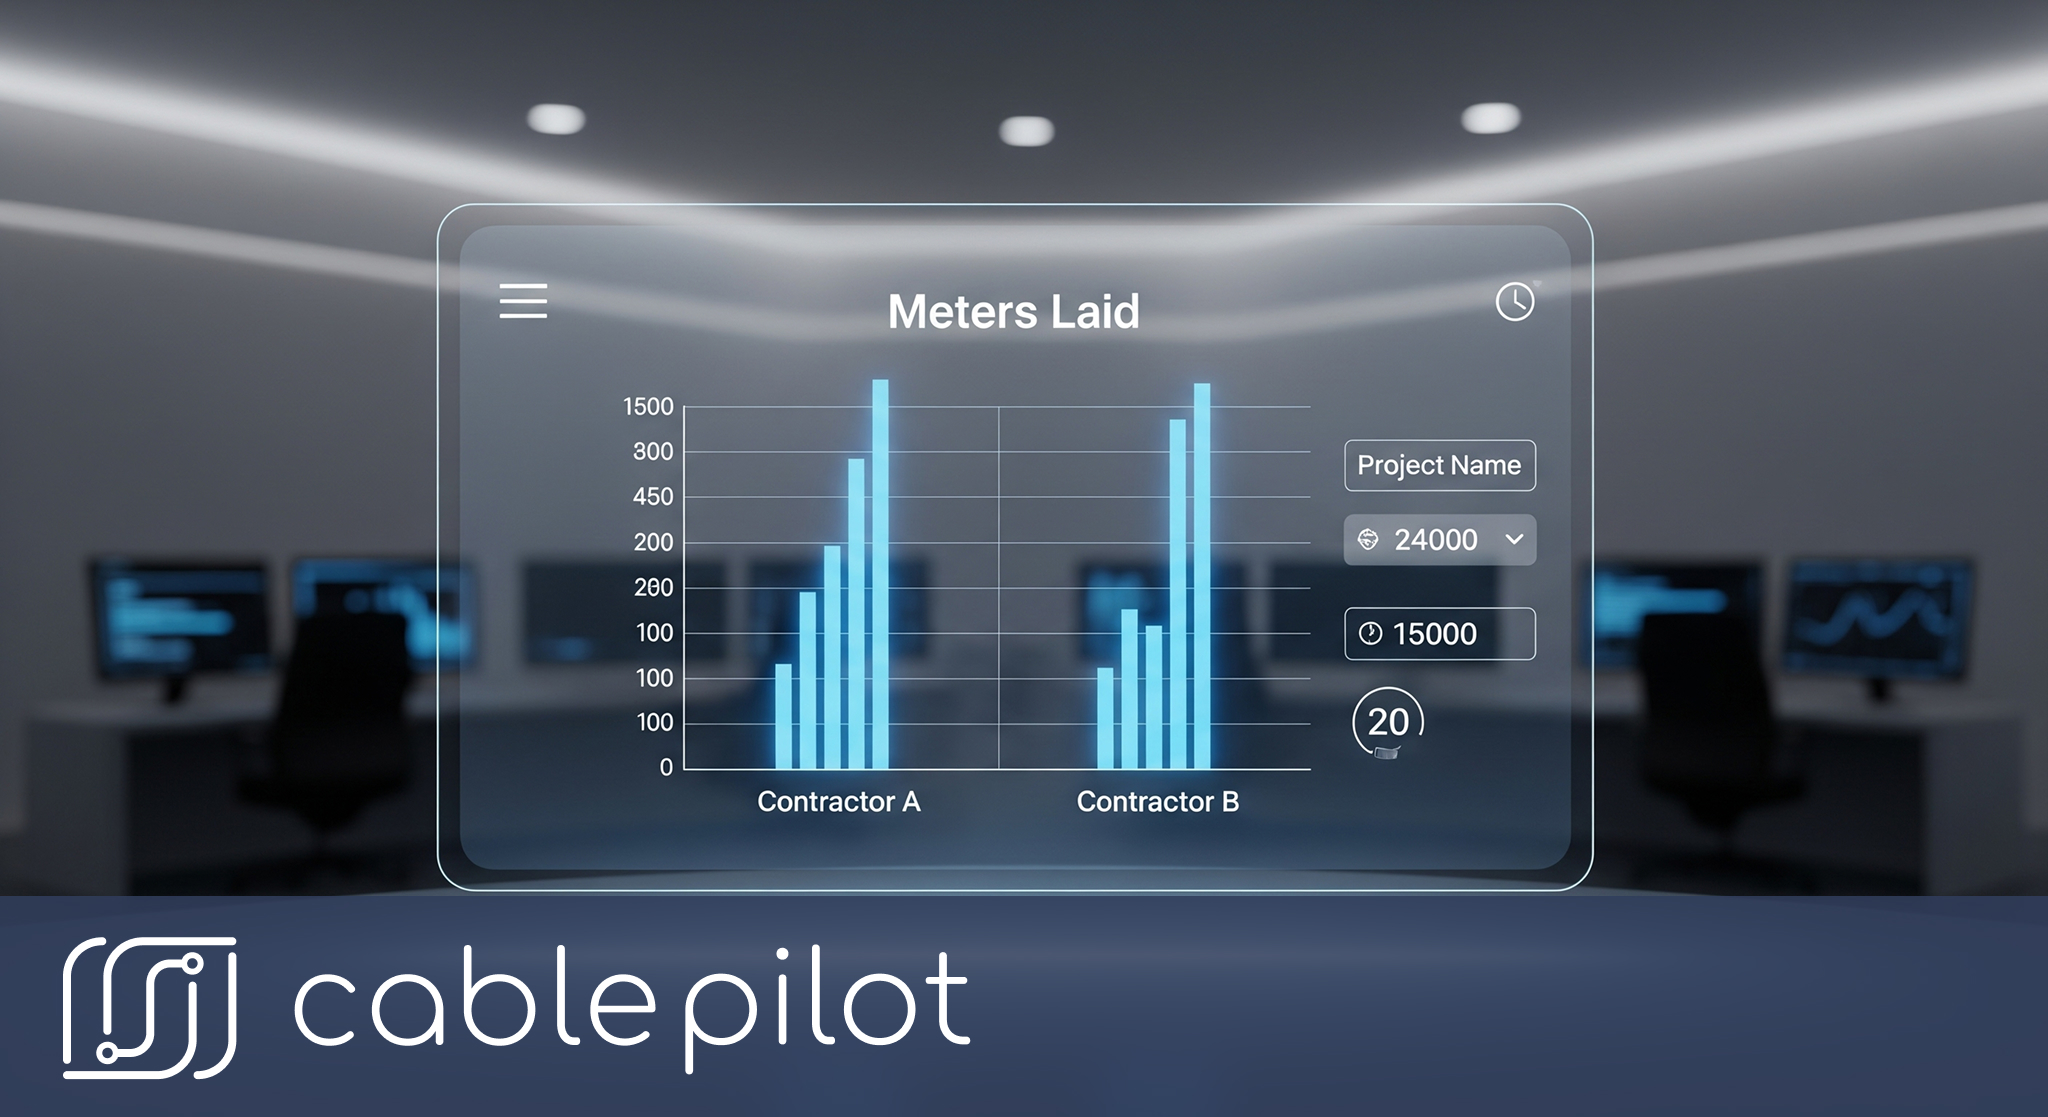
At the end of the week, you receive the following reports, based on the primary metric used for decades: meters of cable pulled.
- Weekly Report – Team A:
- Cables Pulled: 1,200 meters
- Cables Pulled: 1,200 meters
- Weekly Report – Team B:
- Cables Pulled: 1,150 meters
Based on this data, what is your conclusion? The teams are performing at a nearly identical level. The 4% difference is trivial, easily explained by minor on-site variations. You might give both teams a pat on the back and move on, confident that progress is steady.
This is the trap. By relying on a metric that measures length but ignores complexity, you have been presented with a dangerously misleading picture of reality. You feel like you have control, but you are blind to the real performance dynamics of your project. You suspect Team A is stronger, but the data doesn’t back you up, leaving you powerless to act.
The Reveal: Measuring Complexity with Cable Points
The key to objective contractor performance evaluations is to shift from measuring the length of the cable to measuring the complexity of the work. This is where a standardized unit of workload like Cable Points (CP) becomes essential.
As we’ve explored in previous white papers, a CP is not a subjective estimate. It is a calculated value generated by a system that analyzes the objective physical properties of each cable—its cross-section, the number of cores, its weight, armor, and the difficulty of its terminations. It provides a universal, apples-to-apples measure of the true effort required for any given task.
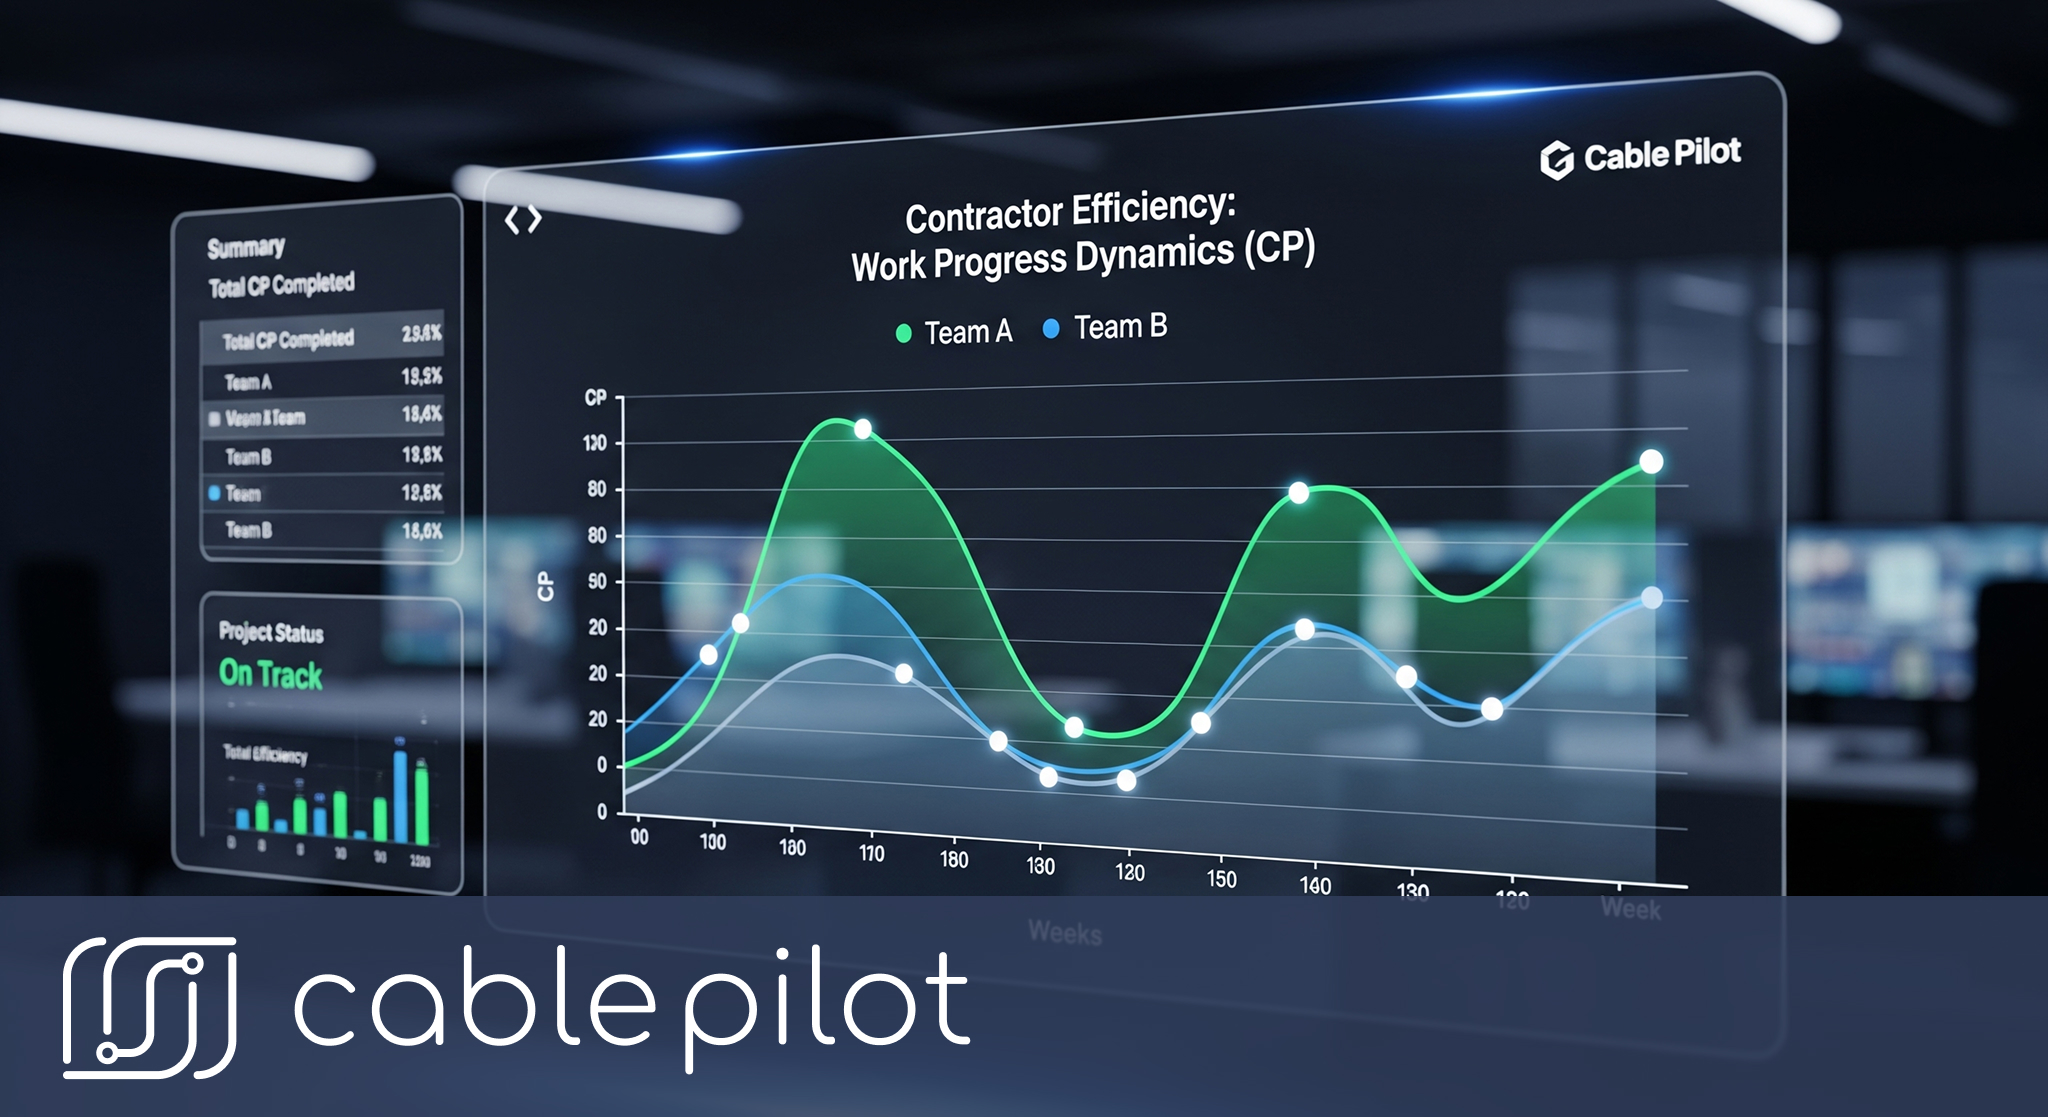
Now, let’s re-run our contractor performance analysis using this superior metric. By analyzing the specific types of cables each team installed, the system calculates the actual workload they completed.
Objective Report – Team A:
- Meters Pulled: 1,200 m
- Workload Completed: 18,000 CP
Analysis: Team A was primarily installing heavy-gauge, multi-core power cables for main distribution systems—tasks with a very high CP value per meter.
Objective Report – Team B:
Meters Pulled: 1,150 m
Workload Completed: 14,500 CP
Analysis: Team B was primarily installing light, single-pair signal cables for lighting and control systems—tasks with a much lower CP value per meter.
The illusion of shipyard efficiency is shattered. The objective data reveals the truth that you suspected all along: Team A’s actual productivity was nearly 25% higher than Team B’s. They delivered significantly more value and overcame a much higher degree of complexity in the same amount of time.
The conversation is no longer about subjective feelings or excuses. It’s about a 3,500 CP performance gap. You are no longer managing in a fog; you are armed with a precise, data-driven insight.
From Data to Action: Managing Shipyard efficiency with Facts
Identifying the performance gap is only the first step. The true power of this analysis lies in what it enables you to do next. Armed with objective data, you can move from mediating disputes to making targeted, effective management decisions.

1. Targeted Problem-Solving for contractor performance analysis
Your conversation with the leader of Team B is now completely different.
- The Old Way (Argument): “I feel like your team is falling behind.” “No, we’re not, our area is just harder.”
- The New Way (Data-Driven Dialogue): “Let’s look at the numbers. Team A is consistently delivering around 3,600 CP per day, while your team is at 2,900 CP. Let’s work together to figure out why. Is it a skills issue? Do you need different tools? Are you facing undocumented blockers in your area?”
You shift the dynamic from accusation to collaborative problem-solving. The data becomes the foundation for an honest conversation about root causes, allowing you to provide targeted support—whether it’s additional training, better equipment, or clearing logistical hurdles—to help Team B improve.
2. Fair and Effective Resource Allocation
You now have a powerful tool for future shipyard efficiency planning. When a new, highly complex work package comes up that involves heavy-duty power distribution, who are you going to assign it to? The data makes the decision for you. You can assign your most complex, highest-value tasks to your proven top performers (Team A), while perhaps assigning lower-complexity work to Team B while they undergo additional training. This is strategic resource allocation, maximizing shipyard efficiency by matching the right team to the right task.
3. Data-Driven Incentive Programs
How do you create a fair and motivating bonus structure? Rewarding teams based on “meters pulled” is counter-productive, as it incentivizes them to focus on easy tasks to inflate their numbers.
With CPs (Cable Points), you can create a system that rewards real value creation. You can set clear targets, such as:
- A weekly bonus for any team that exceeds a productivity target of 3,000 Cable Points per day.
- A project-milestone bonus for completing a total scope of 500,000 Cable Points ahead of schedule.
This aligns the contractors’ financial incentives directly with the project’s goals. You are now paying for real, objectively measured progress, creating a transparent and highly motivating environment for your partners.
4. Building a Library of Performance
Perhaps the most significant long-term benefit is that you are building an invaluable asset: a historical database of your own contractor performance analysis. Over time, you will know the average cost per CP for every type of work, for every contractor you use.
This data becomes your ultimate tool for future bid evaluation and project forecasting. When you receive a new bid, you can compare their proposed price per CP against your historical average, instantly spotting if a bid is too high or dangerously low. You are no longer relying on the market to tell you the price; you are relying on your own hard-won data.
Conclusion: Stop Guessing, Start Measuring
Managing a multi-contractor project based on gut feelings and subjective metrics is a recipe for failure. It creates an environment of conflict, masks inefficiency, and makes it impossible to identify and reward your true top performers.
The transition to a system of standardized workload units like Cable Points is the most critical step you can take to move beyond this chaos. It provides a universal language for complexity and a fair, objective ruler for measuring performance.
By embracing this data-driven project management approach, you are not just creating better reports. You are building a culture of accountability and continuous improvement. You are empowering yourself to make smarter planning decisions, to solve problems based on facts, and to build stronger, more collaborative relationships with your contractors. In the end, you stop guessing at who your best partners are—you know, because the data tells you.
Want to see how objective metrics can transform your own contractor management? Request a personalized demo to learn more about performance analytics
Pingback: Real-time Visibility: 7 Ways To Unlock Success