

In the complex, high-stakes world of shipbuilding, project managers live and die by their numbers. We track budgets, schedules, and material costs with obsessive precision. Yet, we collectively accept a massive, six-figure financial hemorrhage as a simple “cost of doing business.” This drain isn’t from copper prices or labor rates; it’s from administrative waste. It’s the invisible inefficiency of using paper, Excel, and email to manage the physical installation of hundreds of kilometers of cable.
We call it the “Wasting Math.” It’s the daily arithmetic of time spent on non-productive tasks: manual data entry, report aggregation, and error correction. When you finally calculate the true cost, the number is staggering. For a typical electrical installation project, this administrative drag quietly siphons over €210,000 in productive time, every single year.
This isn’t a rounding error. This is a systemic failure. And it’s entirely avoidable.
The Daily Data Drain: What is Administrative Waste?
Administrative waste is the gap between doing work and reporting work. In modern shipbuilding, this gap has become a canyon. We arm our engineers with powerful 3D modeling software, but we send our installers onto the vessel with paper and pens.

The entire construction data management ecosystem relies on a flawed, manual process:
- Work is Done: An installer pulls a cable, connects a junction box, or mounts a piece of equipment.
- Work is Recorded (Manually): They mark a line on a paper cable list. They write notes on a drawing. They fill out a daily progress sheet.
- Data is Transferred (Manually): At the end of the day, a supervisor or foreman collects this stack of marked-up papers, covered in grease and handwritten notes.
- Data is Centralized (Manually): Someone—a supervisor, an engineer, or a data clerk—sits at a computer and painstakingly transcribes these notes into the master Excel cable list.
- Data is Aggregated (Manually): To understand project status, a project manager or engineer must then manually filter, pivot, and consolidate this master spreadsheet to create a progress report.
Every step of this workflow is a source of cost, delay, and error. The time spent on this manual data shuffle is time not spent supervising work, solving engineering problems, or managing risks.
The Anatomy of Wasted Time
Let’s break down the “Wasting Math” for a typical project team. These are conservative estimates based on real-world observations in shipyard electrical projects.
Role 1: The Supervisor / Foreman (10-person team)
The supervisor is the critical link between the office and the vessel. Their primary job is to manage the team, ensure quality, and remove blockers. Yet, a huge portion of their day is consumed by paperwork.
- Daily Data Collection: Walking the vessel to collect paper reports, chasing installers for missing information. (0.5 hours/day)
- Data Transcription & Consolidation: Deciphering handwritten notes and updating the master Excel. This includes correcting typos and fixing incorrect cable numbers entered by the team. (1.5 hours/day)
- Report Generation: Manually compiling a daily progress report for the project manager—filtering by system, area, or work type. (0.5 hours/day)
Total Waste per Supervisor: 2.5 hours per day.

Role 2: The Project Engineer / QA Manager
This role is responsible for technical integrity, quality assurance, and providing accurate progress data to the Project Manager and the client.
- Information “Archeology”: When a discrepancy is found (e.g., the report says a cable is “Connected,” but a photo shows it isn’t), they must hunt for the truth. This involves chasing supervisors, checking emails, and finding the original paper record. (1.0 hour/day)
- Report Validation: Manually cross-referencing the master cable list against design drawings and QA checklists to prepare for inspections. (1.0 hour/day)
- Data Re-formatting: Re-packaging data from the master Excel into specific formats for the classification society, the client, or internal management. (0.5 hours/day)
Total Waste per Engineer/QA: 2.5 hours per day.
Role 3: The Project Manager
The PM’s job is to steer the ship, not row it. They need high-level, accurate data to make strategic decisions. Because they can’t trust the data, they are dragged into the weeds.
- Chasing Status Updates: Making “just checking in” calls and sending emails to supervisors to get the real status, because the report they received is already 48 hours old. (1.0 hour/day)
- Manual KPI Tracking: Manually calculating key metrics like “cables pulled per week,” “connection rate,” or “percent complete by system” because the spreadsheet is too unwieldy. (1.0 hour/day)
Total Waste per Project Manager: 2.0 hours per day.
Calculating the Unacceptable: The €210,000 Hole
Now, let’s attach a cost to this wasted time. We will use a conservative, fully-burdened labor rate of €40 per hour.
- Supervisors (x2): 2 supervisors x 2.5 hours/day = 5 hours/day
- Engineer / QA (x2): 2 engineers x 2.5 hours/day = 5 hours/day
- Project Manager (x1): 1 PM x 2.0 hours/day = 2 hours/day
Total Wasted Time: 12.0 hours per day.
This is 12 hours of your most skilled, expensive personnel, every single day, spent on work that a €10-per-hour data clerk could do. But it gets worse.
- Cost per Day: 12 hours/day * €40/hour = €480 per day
- Cost per Week: €480/day * 5 days/week = €2,400 per week
- Cost per Year: €2,400/week * 44 weeks/year (project duration) = €105,600 per year
This €105,600 is just the tip of the iceberg. This calculation only covers the management team. It completely ignores the single biggest source of waste: the installers themselves.
What about the 15 minutes each installer spends at the end of their shift filling out a paper report? Or the 10 minutes they spend walking back to the container to get the correct drawing because their paper copy was outdated?
Let’s be extremely conservative:
- Installers (x20): 20 installers * 0.5 hours/day (30 mins) on paperwork and information hunting.
- Total Installer Waste: 10 hours/day
- Cost per Day: 10 hours/day * €40/hour = €400 per day
- Cost per Year: €400/day * 5 days/week * 44 weeks = €88,000 per year
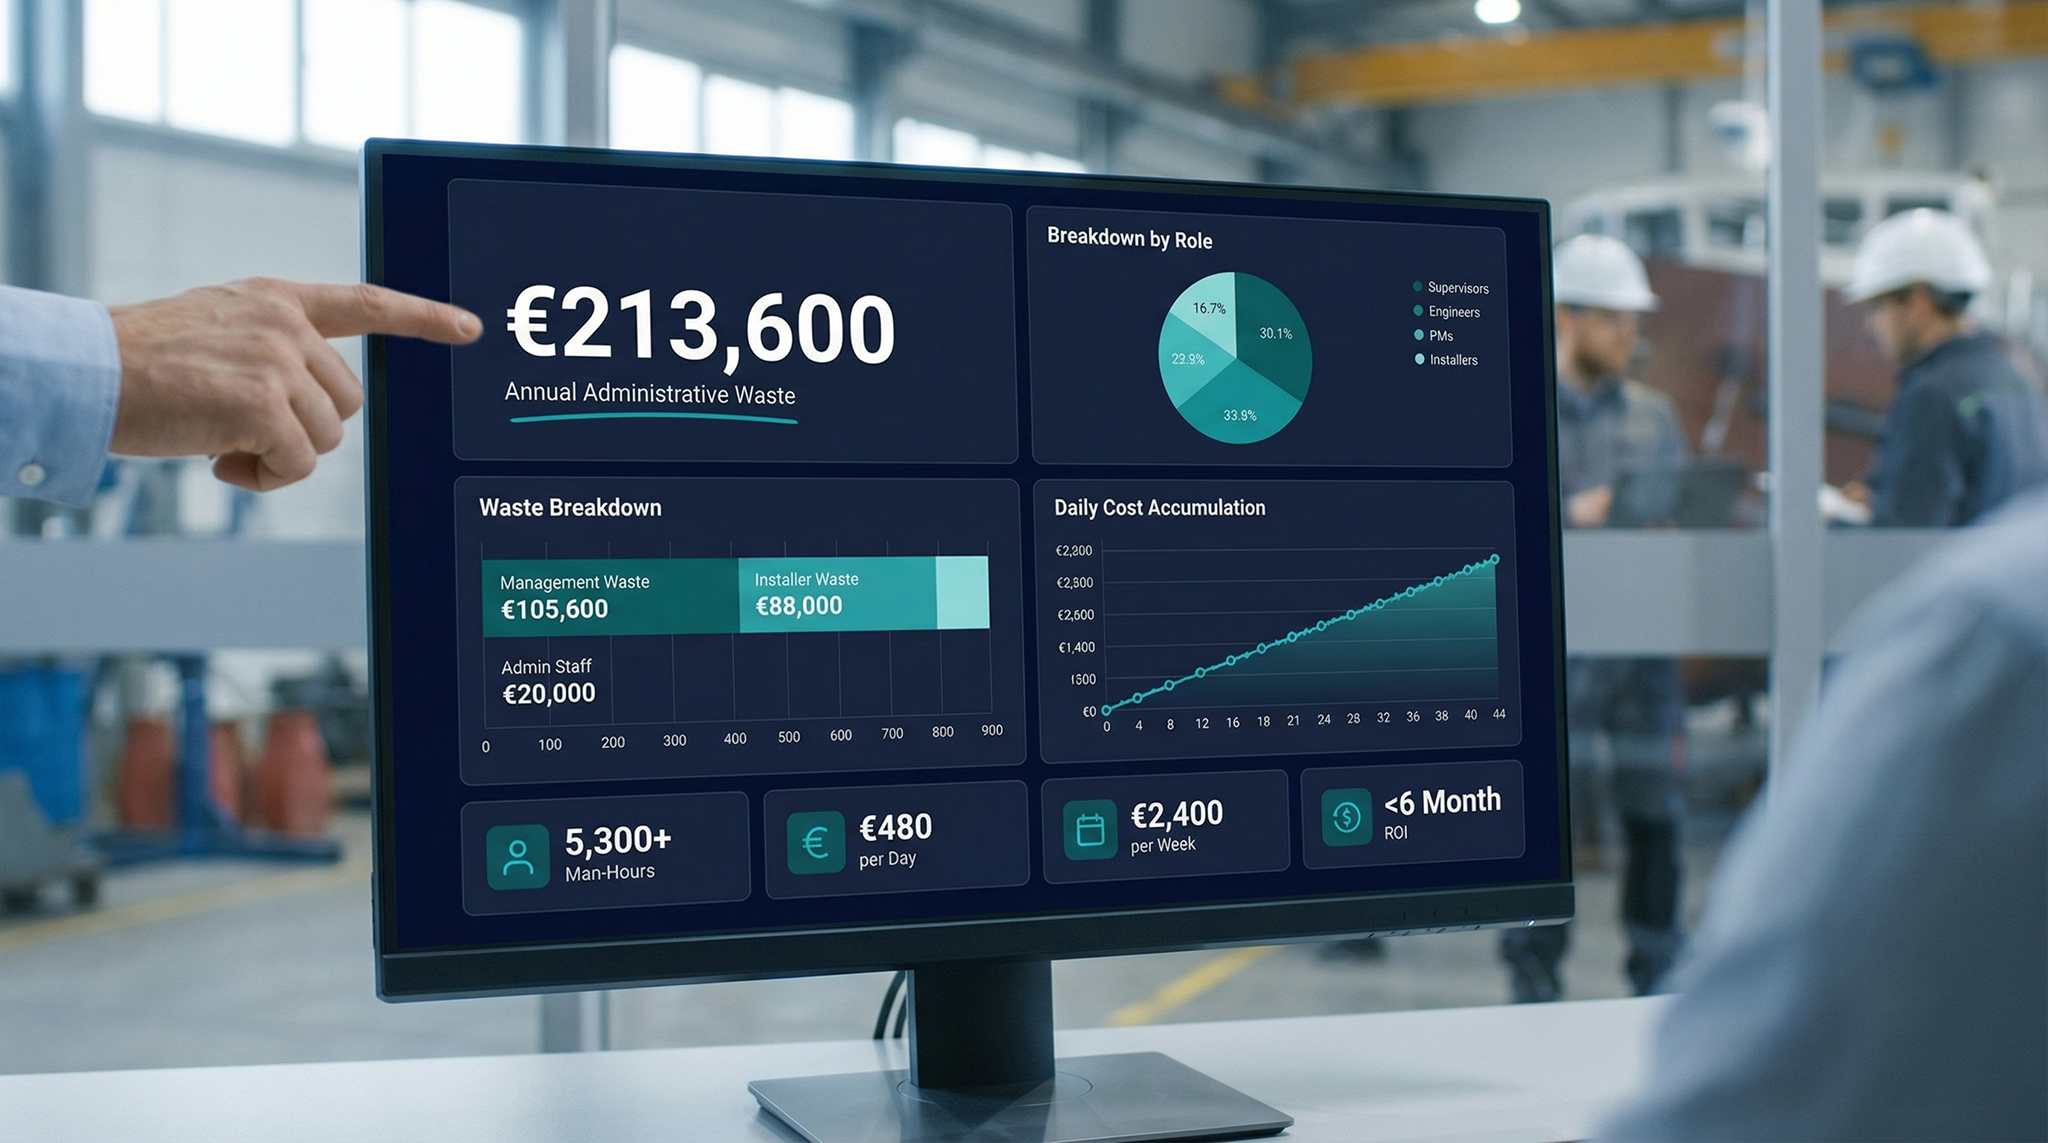
Total Wasting Math:
- Management Waste: €105,600
- Installer Waste: €88,000
- Direct Administrative Waste: €193,600 per year
Add in the cost of a dedicated data entry clerk or admin (let’s say €20,000/year, as their entire job is this manual process), and…
Total Verifiable Annual Waste: > €213,600
This is over 5,300 man-hours. Incinerated. This is the cost of “doing things the way we’ve always done them.”
The Ripple Effect: The True Cost of Rework and Bad Data
The €213,000 figure is shocking, but it still doesn’t capture the full picture. That number only represents the cost of the administrative process itself. It does not include the catastrophic consequences of that broken process.
This is where manual data management transitions from a “cost” to one of the most significant shipbuilding project risks.
- The Cost of Rework: An installer connects a cable based on an outdated paper drawing. The connection is wrong. It fails inspection. Now, a new team must be dispatched to find the error, disconnect the cable, pull the correct one (if it’s even ordered), and reconnect it. The cost of rework isn’t just the labor; it’s the lost time, the new materials, and the schedule delay that ripples through the entire project.
- Failed Inspections: The QA manager prepares for a classification society inspection. The Excel sheet says 100% of cables in Fire Zone 3 are “Tested.” The inspector arrives, picks a junction box at random, and finds two cables unconnected. The inspection fails. The project’s credibility is damaged, and the vessel’s progress is halted, all because the “single source of truth” was a spreadsheet that was 72 hours out of date.
- Material Mismanagement: The project manager looks at the spreadsheet and sees 80% of cable ‘X’ is installed. They order the remaining 20%. What the spreadsheet didn’t show was that 15% of the installed cable was the wrong type and needs to be replaced. The project now has a critical material shortage, leading to expensive air freight and idle teams.
The real cost of manual tracking isn’t €213,000. It’s that figure, plus the unquantifiable but massive cost of rework, schedule delays, and reputational damage.
The Solution: From Manual Entry to Real-Time Intelligence
You cannot fix this problem by hiring more clerks or demanding better reports. You fix it by eliminating the manual process entirely. You fix it by closing the “air gap” between the installer on the vessel and the project data in the office.
This is what a modern construction data management platform like Cable Pilot is designed to do. It’s not just “Excel in the cloud.” It is a fundamental redesign of the information workflow.
1. Empowering the Installer: The Smartphone as the Tool
The waste begins with the installer’s paper sheet. The solution starts by replacing it.
Imagine this: An installer walks into a compartment. They scan a QR code on the bulkhead with their smartphone. The Cable Pilot application instantly shows them every task (cables, equipment, transits) assigned to that specific location.
- They pull a cable. They scan QR-code and tap the button their screen and set the status to “pulled”
- They connect the wires. They tap again: “Connected.”
- They perform a meg-test. They tap: “Tested.”
The data is captured once, at the source, at the moment of installation. There is no paper. There is no end-of-day report. There is no data entry. The installer’s 30-minute administrative burden is reduced to 30 seconds of tapping on their smartphone.
2. Freeing the Supervisor: From Data Clerk to Manager
The supervisor’s 2.5 hours of waste are eliminated overnight. They no longer collect paper. They no longer transcribe notes.
Instead, they open their web application dashboard. They see a live, color-coded feed of project progress, updated in real-time by their team’s smartphones. Their job transforms.
- Before: “Who has the progress sheet for Deck 5?”
- After: “I see Deck 5 is 90% ‘Mounted’ but only 30% ‘Connected.’ I’m sending two electricians there right now.”
The platform allows them to manage by exception. They can instantly filter the entire cable list to find bottlenecks: “Show me all ‘pulled’ cables that haven’t been ‘Connected’ for more than 3 days.” This is actionable intelligence, not historical data entry.
3. Arming the PM & QA: The Digital Twin as the Single Source of Truth
For the Project Manager and QA Manager, the change is profound. The master cable list is no longer a static, unreliable spreadsheet. It is a living digital twin of the vessel’s electrical installation.
- Real-Time KPIs: The PM doesn’t need to calculate progress. They see it. Live dashboards show cables installed per day, connections made per team, and percent complete by system, area, or client-defined milestone.
- Frictionless Quality Assurance: The QA manager’s work is streamlined. When an installer marks a cable as “Tested,” it can automatically appear in the QA manager’s queue for verification. The QA manager performs the check, taps “Checked” on their own device, and the item is locked, creating a permanent, auditable quality record.
- Transparent Reporting: When the client asks for a progress report, the PM doesn’t spend a day building one. They generate a report from the live data with one click, or better yet, give the client read-only access to a dedicated dashboard. This builds trust and transparency, turning data into a competitive advantage.

The Unbeatable Business Case (Revisited)
Let’s return to our “Wasting Math.” The €213,000 in annual administrative waste is not a “cost of doing business.” It is a choice.
A robust cable installation software solution costs a fraction of that amount. The return on investment isn’t calculated in years; it’s calculated in months.
By implementing a centralized construction data management platform, you are not just “buying an app.” You are making a strategic investment in:
- Operational Efficiency: You are reclaiming over 5,300 man-hours of your most skilled employees’ time and re-allocating it from administrative drag to productive, value-adding work.
- Risk Mitigation: You are dramatically reducing the cost of rework by ensuring installers always have the correct, up-to-date information. You are eliminating the risk of failed inspections by building a provable, digital “golden thread” of quality.
- Profitability: You are stopping a €213,000+ annual leak. This money flows directly back to your project’s bottom line.
- Team Morale: You are removing the single most frustrating part of your team’s job—the endless, thankless paperwork—and giving them tools that help them succeed.
Stop accepting the Wasting Math. The losses are real, they are quantifiable, and they are happening every day. It’s time to stop draining time and let your team do the productive, high-value work they were hired for.
Take control of your data, eliminate the hidden time drains, and transform your project’s profitability.
Stop Guessing. Start Calculating.
See how Cable Pilot’s digital platform can eliminate administrative waste and provide a real-time single source of truth for your electrical installation projects. Request a demo today and build your own business case.
Pingback: The Scaling Trap In Shipbuilding Projects: A Technical Insight