

Real-Time Shipbuilding Analytics for Electrical Installation
See the Real Status of Every Installation Phase.
Every shipyard project manager knows the scenario: you ask a contractor for a progress update and receive a figure that was accurate three days ago. Paper forms, end-of-shift spreadsheet summaries, and verbal briefings create a structural lag between what is actually happening on the vessel and what management knows. By the time consolidated data reaches a coordinator’s desk, the situation has already moved on.
Cable Pilot’s Insights module is purpose-built shipbuilding analytics for electrical installation management. It gives project managers, electrical coordinators, and supervisors a live view of every installation phase — updated automatically as field workers submit progress reports through the smartphone app. No manual data consolidation, no end-of-day paperwork, no guesswork about the actual state of work on board.
Five Dedicated Shipbuilding Analytics Dashboards
Cable Pilot organizes its analytical layer into five dedicated dashboards, each focused on a specific phase of the electrical installation lifecycle: cable pulling, equipment mounting, cable connection, transit sealing, and a total workload overview measured in Cable Points. Cable Points are a standardized workload unit that quantifies the effort required for each cable and equipment item across all installation phases, giving every project a single consistent measure of progress.
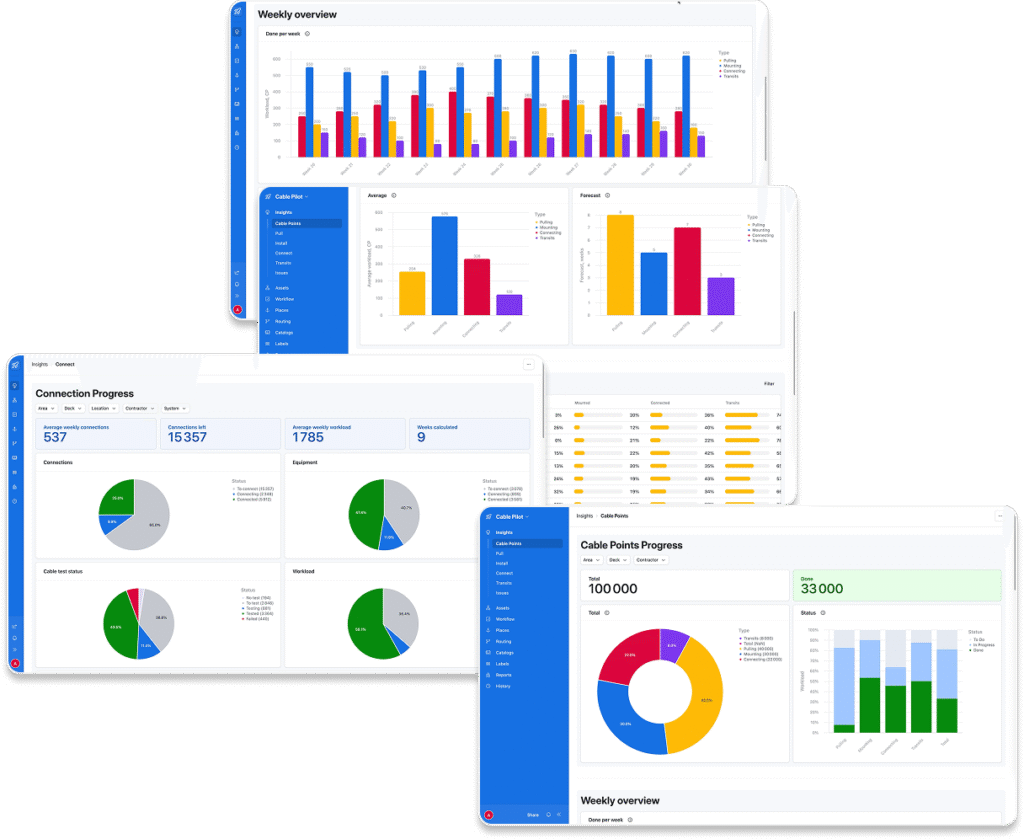
Each dashboard opens with a full-screen Overview section containing KPI tiles, status charts, and weekly trend charts — all visible without scrolling. Detailed breakdowns by area, deck, contractor, and system follow below. The structure is consistent across all five dashboards, which means users navigate the full analytical suite after learning the interface once.
Cable Points: True Workload at a Glance
Counting cables is a fundamentally insufficient measure of electrical installation progress. A simple lighting circuit and a long power cable are not equivalent units of effort, yet raw item counts treat them as identical. Cable Points resolve this by capturing the true workload behind each cable and equipment item, so that progress percentages reflect actual labor consumption — not just item tallies.
The Cable Points dashboard presents the most comprehensive shipbuilding analytics view: a unified picture of total installation workload across all work types simultaneously. The Overview section shows total Cable Points, completed points to date, and remaining workload distributed across Pull, Mount, Connect, and Transits. Donut charts visualize workload distribution by type. A “Done per week” bar chart shows completed Cable Points each calendar week from project start to the present, making it immediately clear whether project pace is building, stable, or declining. Average weekly performance and the calculated forecast appear alongside the charts, so historical picture and forward projection are always in the same view.
Pull Progress: Cable Routing Tracked to Completion
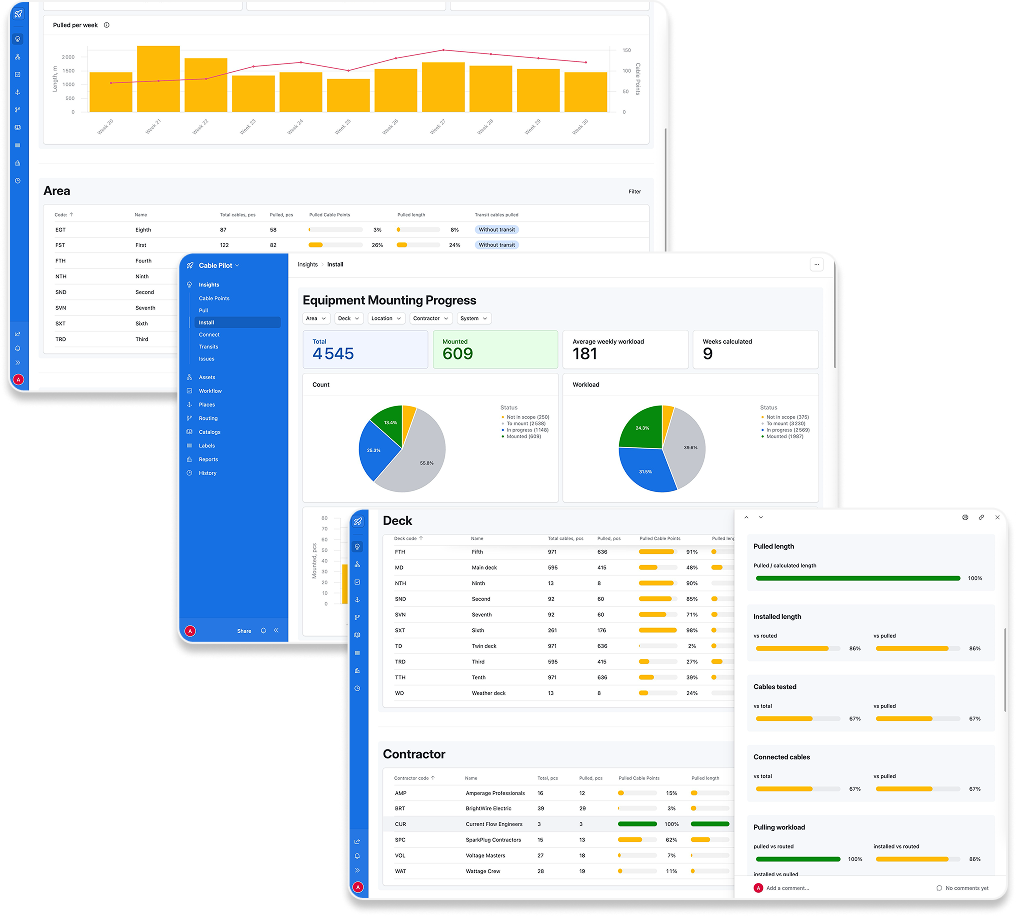
The Pull dashboard delivers detailed progress tracking for cable pulling. Three KPI tiles show total cable count, total pull length in meters, and total workload in Cable Points. Three pie charts break down the current pulling stage — To Pull, Pulling, and Pulled — measured simultaneously by count, by length, and by workload.
This three-view approach matters in practice. A project that has pulled many short cables but left all the long, high-workload routes for later will show very different numbers in the count view versus the workload view. The contractor comparison section places each team’s performance side by side: tables showing completed and remaining work in count, meters, and Cable Points, with a calculated forecast for each contractor. A “Pulled per week” combined bar and trend chart shows weekly pulling throughput from project start to today. Placing current status alongside historical rate data is where raw cable figures become genuine shipbuilding analytics — the kind that shows whether a contractor is on pace or quietly falling behind.
Equipment Installation: Mounting Progress by Area, Deck, and System
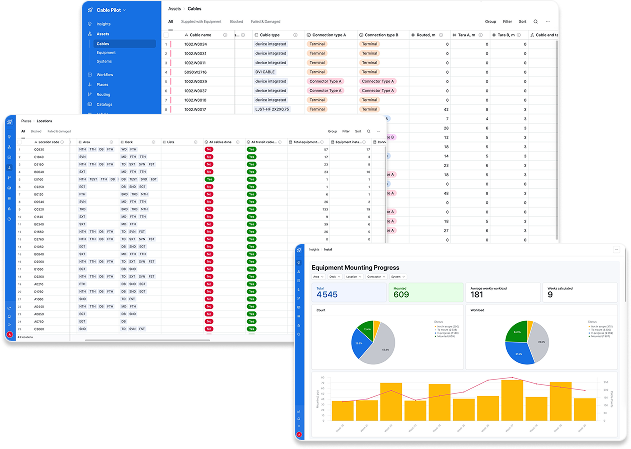
The Install dashboard tracks equipment mounting status across the vessel. Summary KPI tiles display total equipment count, mounted count, average weekly workload, and calculated weeks to completion. Status charts show the distribution of equipment across Mounted, In Progress, To Mount, and Not in Scope categories — both by count and by workload percentage.
Below the overview, area, deck, and contractor breakdown tables show completion progress per organizational slice. The system-level breakdown shows mounting progress for each electrical system across the vessel alongside the standard dimensional tables. When multiple contractors share equipment installation responsibility across overlapping systems on the same build, this view is where scope gaps and scheduling conflicts become visible before they escalate into delays.
Stop Guessing Progress. Start Measuring It in Real Time.
Cable Connection: Termination and Testing in One View
The Connect dashboard brings cable connection progress and testing status into a single view. Four KPI tiles answer the project manager’s core scheduling question at a glance: average weekly connections, connections remaining, average weekly workload, and weeks calculated to completion. Donut charts show the distribution of cable connections, equipment connections, and workload across Connected, Connecting, and To Connect stages.
A separate testing status chart — with cables categorized as no test, to test, testing, tested, and failed — sits alongside the connection data. Since cable testing and connection termination are closely linked in the inspection and handover documentation workflow, combining both in one analytical view reduces the need to cross-reference separate reports. Area, deck, contractor, and system breakdown tables complete the progress tracking picture for this phase, each with independent filtering and drilldown support.
Transit Sealing: Penetration Closure Tracked Through All Stages
Transits — cable penetrations through bulkheads and decks — are among the most compliance-sensitive elements of vessel electrical work. Their completion status determines when compartments can be closed and handed to the next trade or submitted for classification inspection. The Transits dashboard tracks each penetration through four stages: open, filling, filled, and sealed.
KPI tiles show total transit count, sealed count, average weekly workload, and weeks to completion. Status charts and weekly trend lines provide both a current snapshot and a historical view of sealing throughput. Area and deck breakdown tables show completion percentages per stage for each zone and deck level, directly answering the pre-handover question coordinators ask most often: which compartments are ready to close?
Shipbuilding Analytics Across Every Organizational Dimension
Beyond the five process dashboards, Cable Pilot provides a comprehensive statistics layer that makes shipbuilding analytics available across every organizational dimension of the project. Dedicated statistics views exist for cables and for equipment separately, and a combined view merges both data streams into a single aggregated table — cable and equipment figures for each dimension placed side by side in one place.
Statistics are available broken down by discipline, contractor, deck, and area — for cables and equipment independently, and in combined form. The combined statistics view is particularly useful when reviewing a contractor’s full scope: their cable work and equipment work appear together in one table, without switching between views or requesting a custom export. The combined dimension tables bring cable-pulling progress and equipment-mounting progress for each discipline or area into a single row — especially useful during the connection and testing phases, when the pace of cable work and equipment readiness need to be understood in relation to each other.
Forecast Calculations Built Into Shipbuilding Analytics
Every Insights dashboard includes an automatically calculated forecast: the number of weeks remaining to complete the current scope, derived directly from the actual average weekly pace recorded in the system. This figure is not entered by a planner. It is computed from the real rate at which work is being completed and updates as new field reports arrive.
For cable pulling, the forecast is calculated per contractor, so it is immediately clear which teams are on pace and which present schedule risk. For connection and transit sealing, forecasts appear at project level and within the area and deck breakdown tables. Coordinators gain the factual basis to reallocate resources before a delay becomes structural rather than manageable. Forecast figures sit alongside the weekly progress charts in every Overview section, pairing historical performance trend with forward projection in the same view. That combination — measured pace plus calculated runway — is what transforms shipbuilding analytics from a reporting function into a genuine decision-support tool for schedule control.
Interactive Filters and Drilldown Navigation
All five Insights dashboards share a consistent filtering model. Filters for Area, Deck, Contractor, System, and Location sit at the top of every Insights page and update all Overview metrics instantly on selection. By default, all filters are cleared and dashboards display full-project data. A coordinator focused on a specific zone selects their area and sees only the relevant numbers. A contractor supervisor isolates their team’s performance data in seconds.
Below the Overview, the area, deck, contractor, and system breakdown sections each carry independent filters for deeper cross-comparison. Every row in every breakdown table supports drilldown: selecting a contractor or a deck opens the detailed record view for that specific slice of the project. This layered navigation — from the project-level dashboard to a single zone to individual cable and equipment records — is what makes the shipbuilding analytics layer useful for daily operational decisions, not just periodic reporting cycles.
Role-Based Access: The Right View for Every Stakeholder
Cable Pilot’s Insights module is designed for multiple user roles with different information requirements. Project managers, construction managers, supervisors, engineers, quality managers, and external planning managers each access the dashboards relevant to their responsibilities. An external planning manager can view reporting data without access to data entry functions. A quality manager can focus on testing and connection analytics without the full pulling dataset in view.
Role-based access to shipbuilding analytics means each user receives a focused interface aligned with their responsibilities — not a full data set requiring extensive filtering to become useful. When exceptions occur, they are visible immediately. The filter and drilldown tools allow any user to investigate anomalies without depending on someone else to prepare a separate report.
Replace Weekly Reports with Live Project Intelligence.
From Stale Reports to Live Shipbuilding Analytics
Before Cable Pilot, the standard workflow for tracking electrical installation progress in shipbuilding looked like this: contractors updated their own records, submitted weekly summaries, and coordination meetings were held on data that was already days old. The gap between what was happening on the vessel and what management knew was built into the process — a structural inefficiency, not an incidental one.
Cable Pilot’s shipbuilding analytics layer eliminates that gap. Every status update submitted through the smartphone app flows directly into the aggregated statistics and dashboard charts. When a cable is pulled, the Pull dashboard updates. When equipment is mounted, the Install dashboard reflects it. There is no intermediate step, no manual re-entry, no waiting for an end-of-week roll-up.
For projects where thousands of cables, hundreds of equipment items, and multiple contractors are active simultaneously across a vessel, that direct connection between field reporting and shipbuilding analytics is what enables genuinely proactive project management. Schedule risks surface when they emerge, not a week later. Forecasts update as pace changes. Contractor performance monitoring becomes continuous — not a periodic reconciliation.
Cable Pilot’s shipbuilding analytics platform gives every stakeholder in the electrical installation process — from the shipyard electrical coordinator to the contractor site supervisor — a shared, accurate, and current view of project status. That shared visibility, grounded in live field data, is how complex vessel projects are kept on schedule and delivered with the documentation integrity that classification societies and shipowners expect.